For cattle ranchers Early access

Your whole ranch, on one table.

Grazed Roots rebuilds your land as a living model from its real terrain, creeks, soils and rain. Put your herd on it, draw a fence, pick how long they stay, and see what the grass does next, from the kitchen table or your phone in the truck.

Watch the tour Already set up? Login
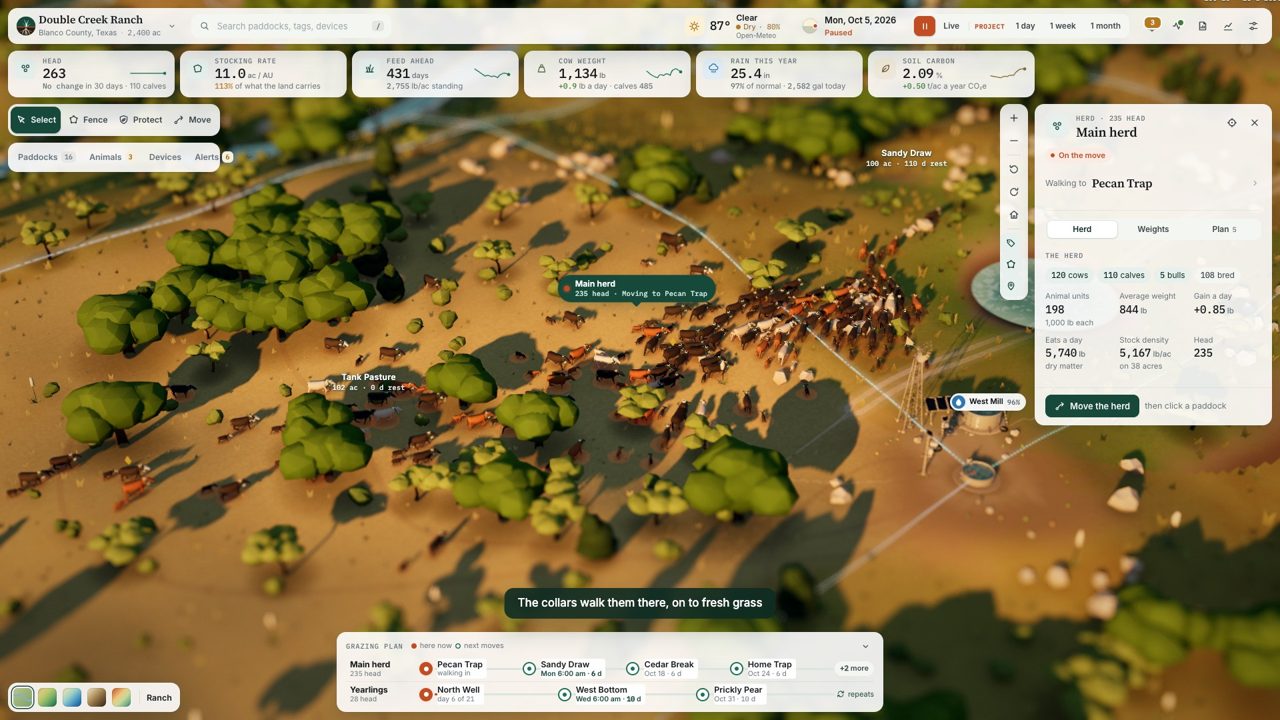
The main herd of 422 cattle streaming across open range toward a new paddock, on a model of a Texas ranch at golden hour
A 14-second loop from the demo ranch: the main herd crossing open range near West Mill.

How it works

From a line on a map to a ranch you can run.

Setting up takes an afternoon, not a season. You bring what you already have; the platform fills in the rest from public data.

  1. 1

    Your land

    Drop in a KML from Google Earth or Google My Maps. It's rebuilt from real terrain, OpenStreetMap creeks, roads and buildings, satellite tree cover and USDA soils.

  2. 2

    Your herd

    Type in your counts, or upload the herd sheet you already keep: CattleMax, AgriWebb, or any CSV or Excel file. Cows, calves, bulls and yearlings land on the map.

  3. 3

    Your kit

    Say what you have, or plan to have: Grazed Roots collars, ear tags, and which water points get a walk-over scale. Smart troughs, cameras, weather stations, pumps and gates report in too.

  4. 4

    Run it

    From your phone or the kitchen table: draw fences, move the herd with a stay length, schedule the 6 am move, and watch grass, water, weights and calving respond, a day or a month at a time.

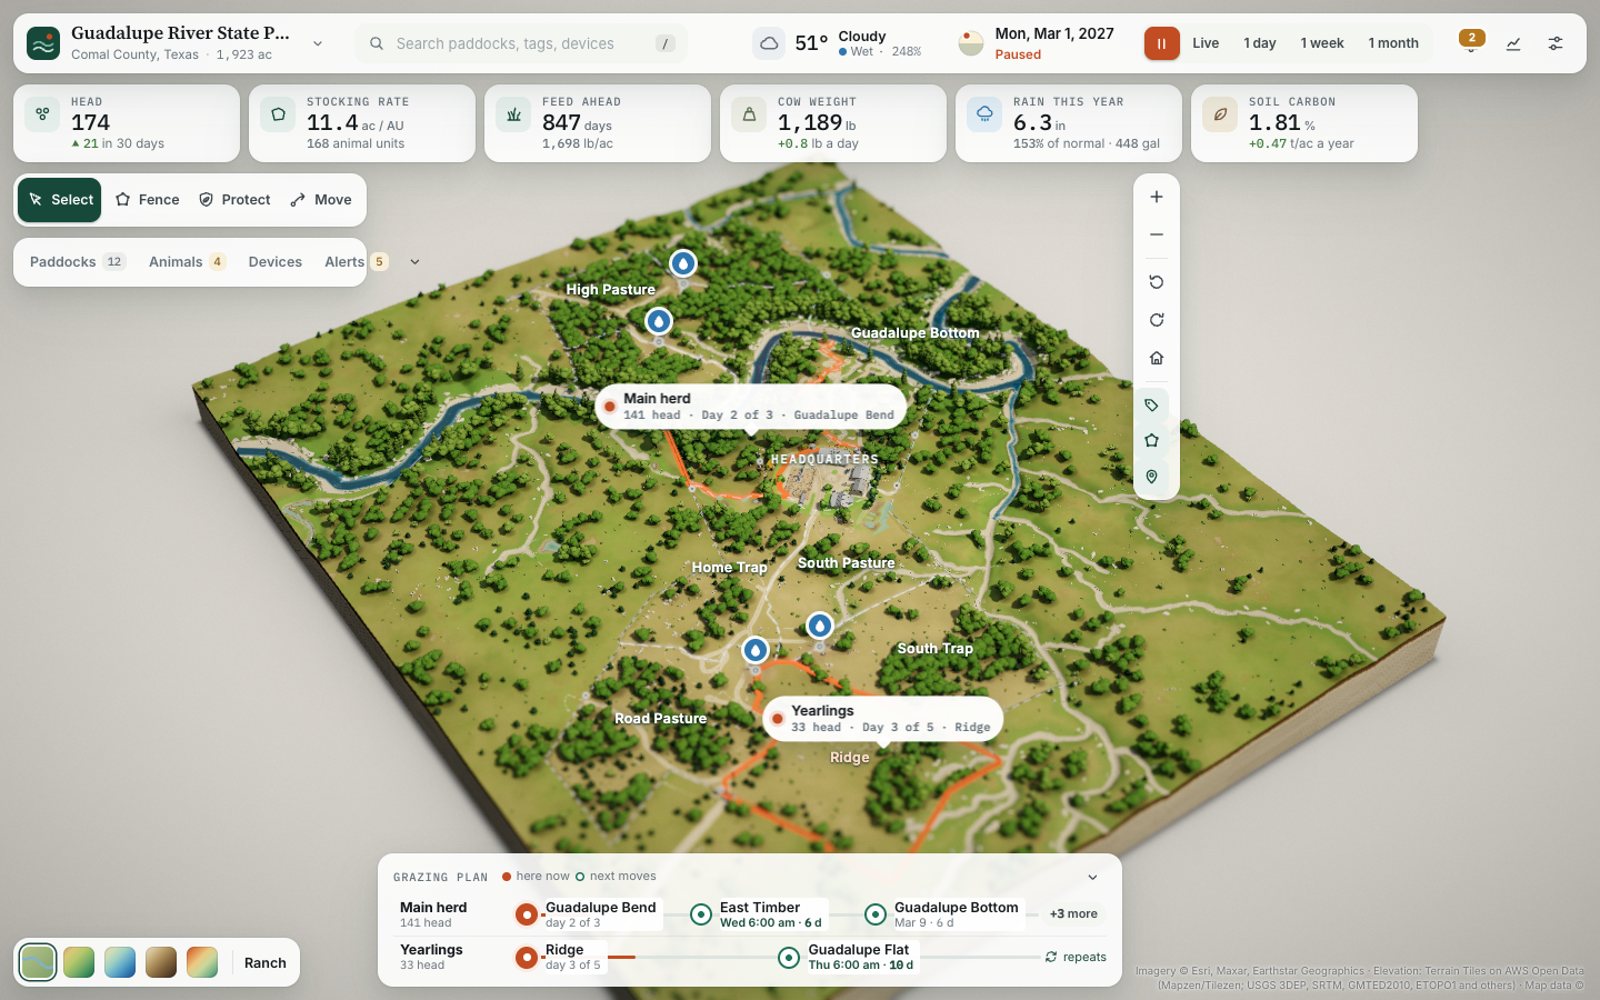
The same boundary rebuilt as a 3D model: wooded Hill Country terrain, the Guadalupe River, roads, headquarters, paddocks and water points What you get back

Drag across. On the left, the public boundary of Guadalupe River State Park as a KML file. On the right, what the platform built from it on its own: terrain, river, roads, tree cover and a starting set of paddocks.

On your phone

Built for the cab of the truck, not the office.

Most days you're not at a desk. The whole ranch fits in your pocket: check the herd from the truck, see who needs a look, and draw tomorrow's paddock with your thumb.

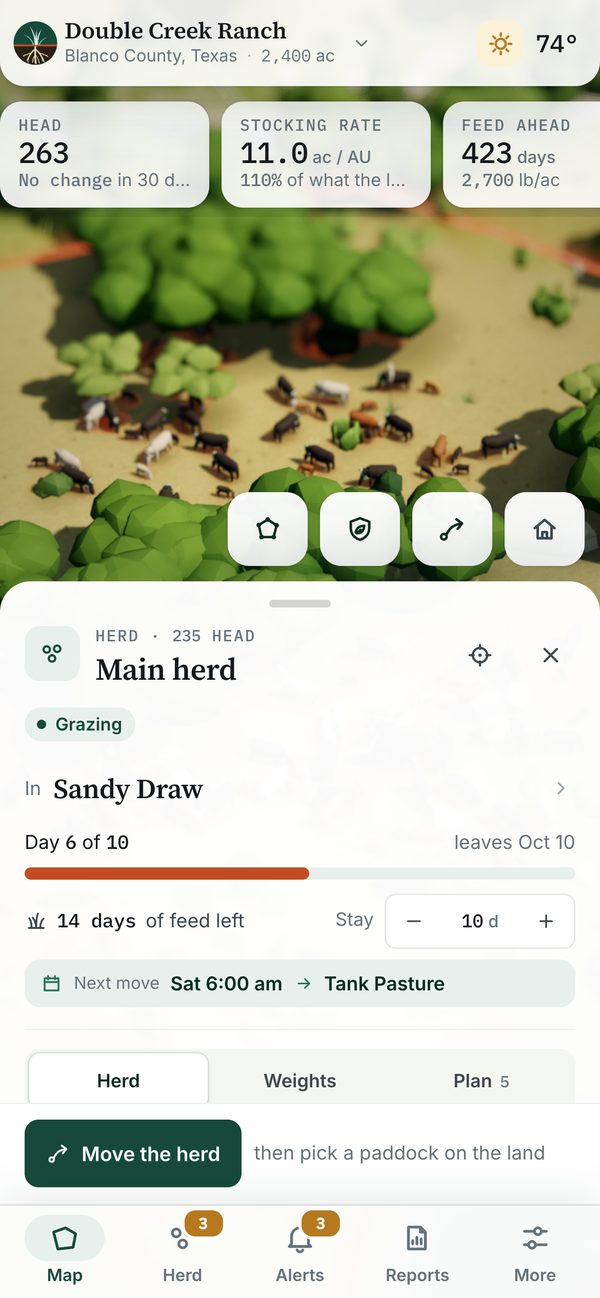
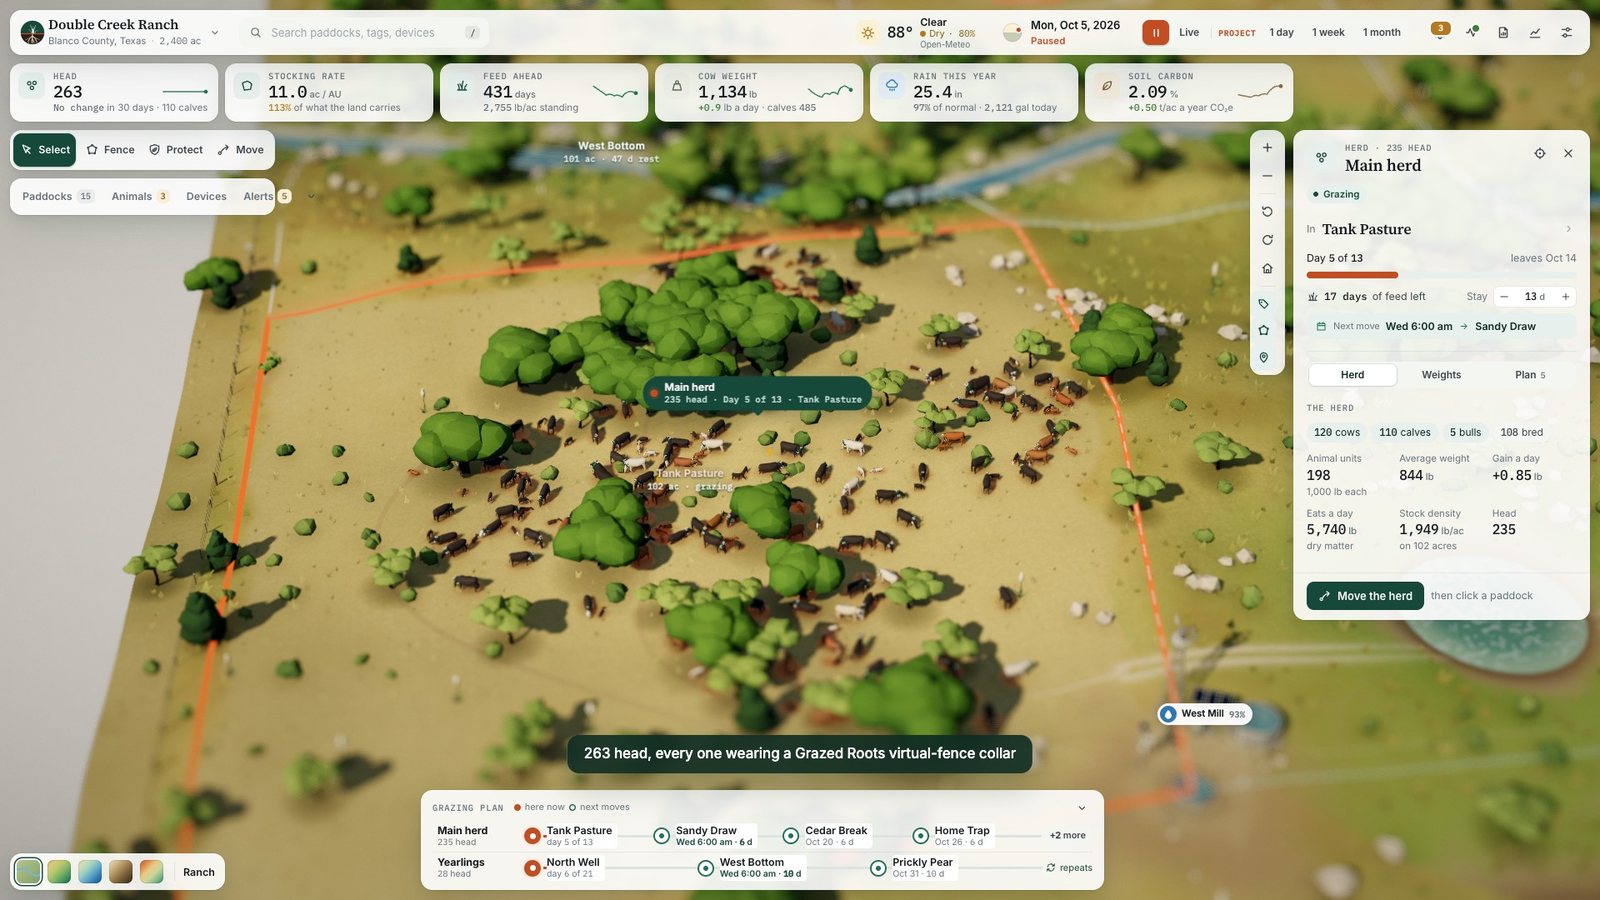
  1. Phone screen: the main herd card, with head count by class and gain a day
    The herd, from the truck
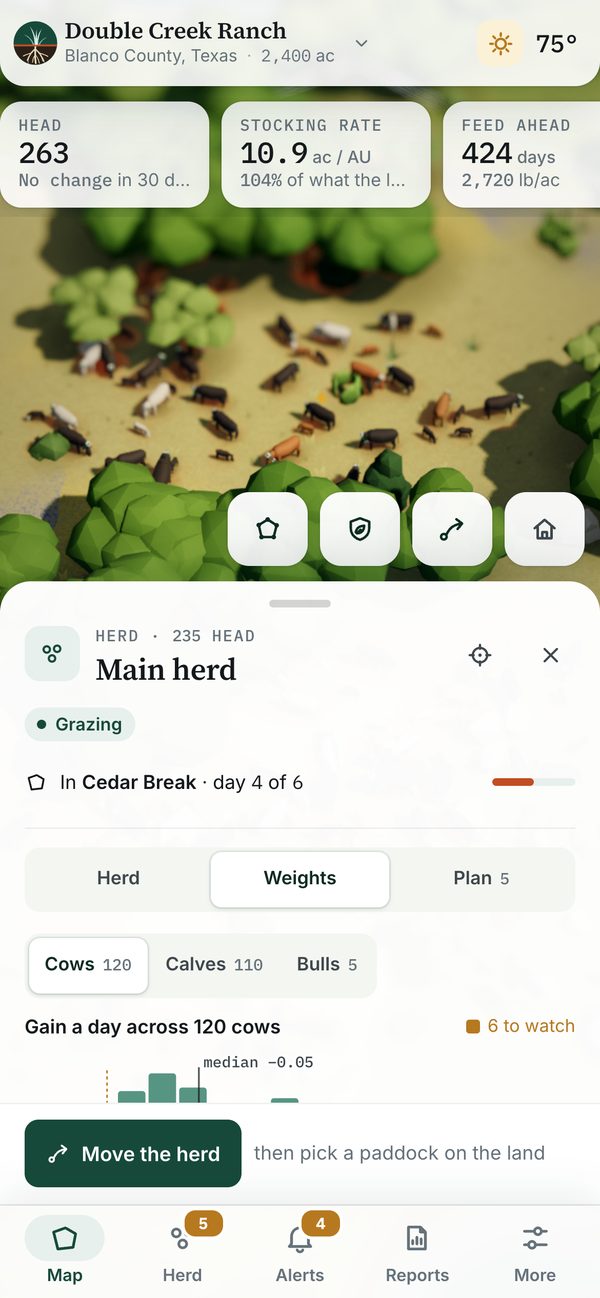
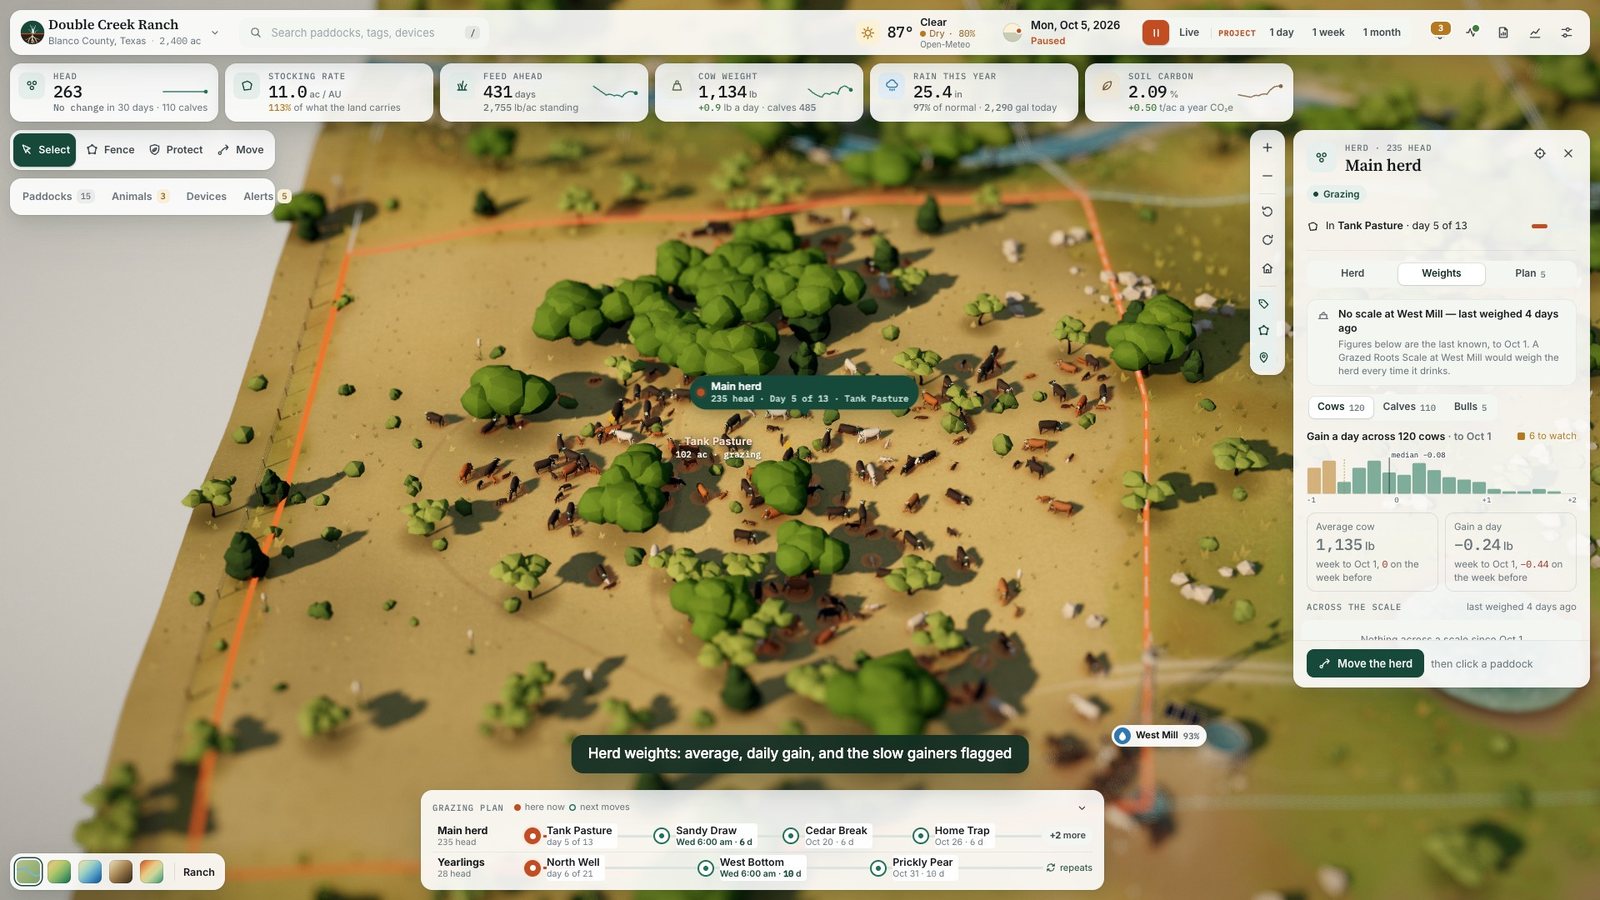
  2. Phone screen: herd weights from the walk-over scale, with slow gainers flagged
    Weighed at the trough
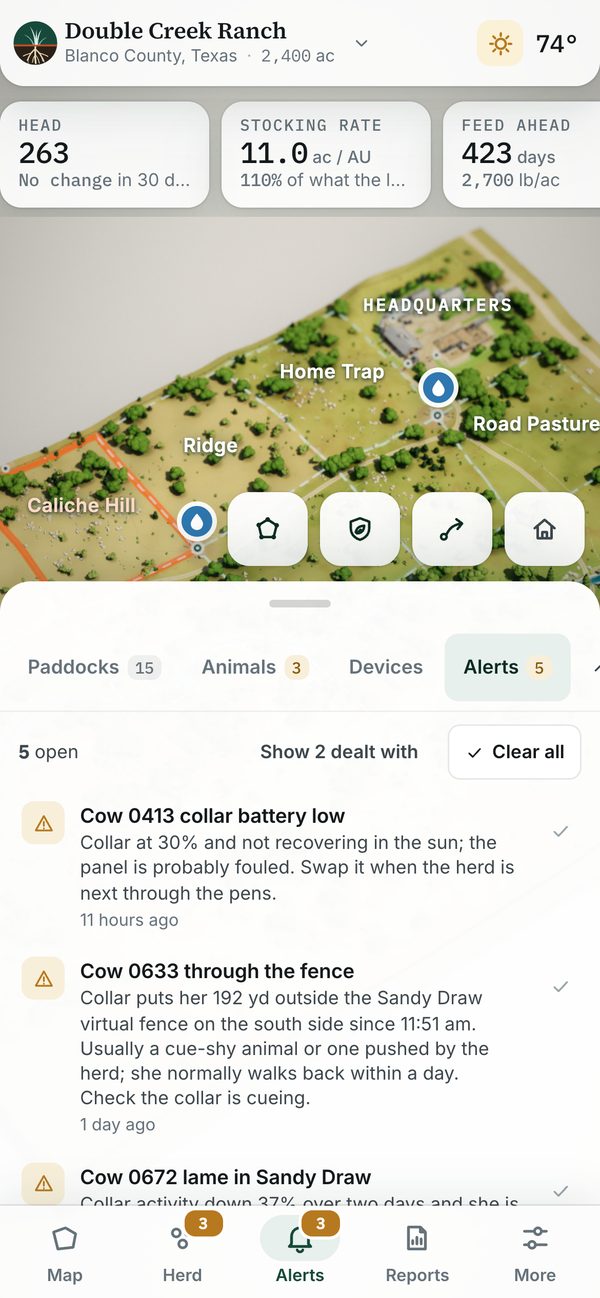
  3. Phone screen: collar alerts listing the animals to check first
    Who needs a look
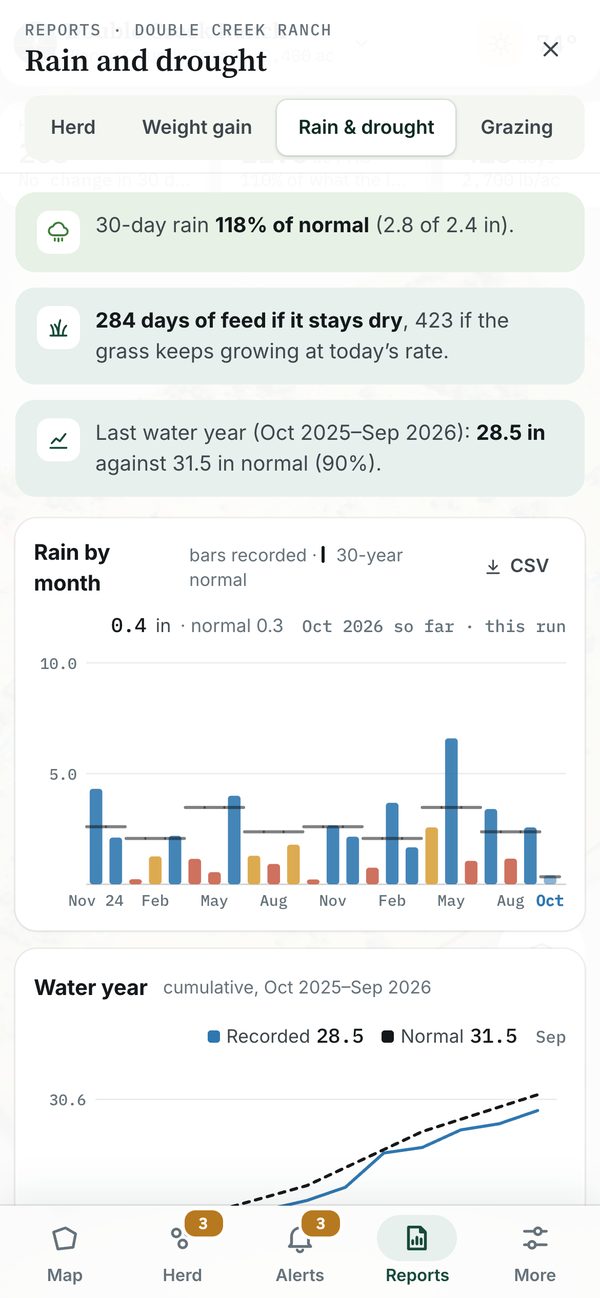
  4. Phone screen: rain over the last 7, 30 and 90 days against normal, and the week ahead
    Is it raining enough?
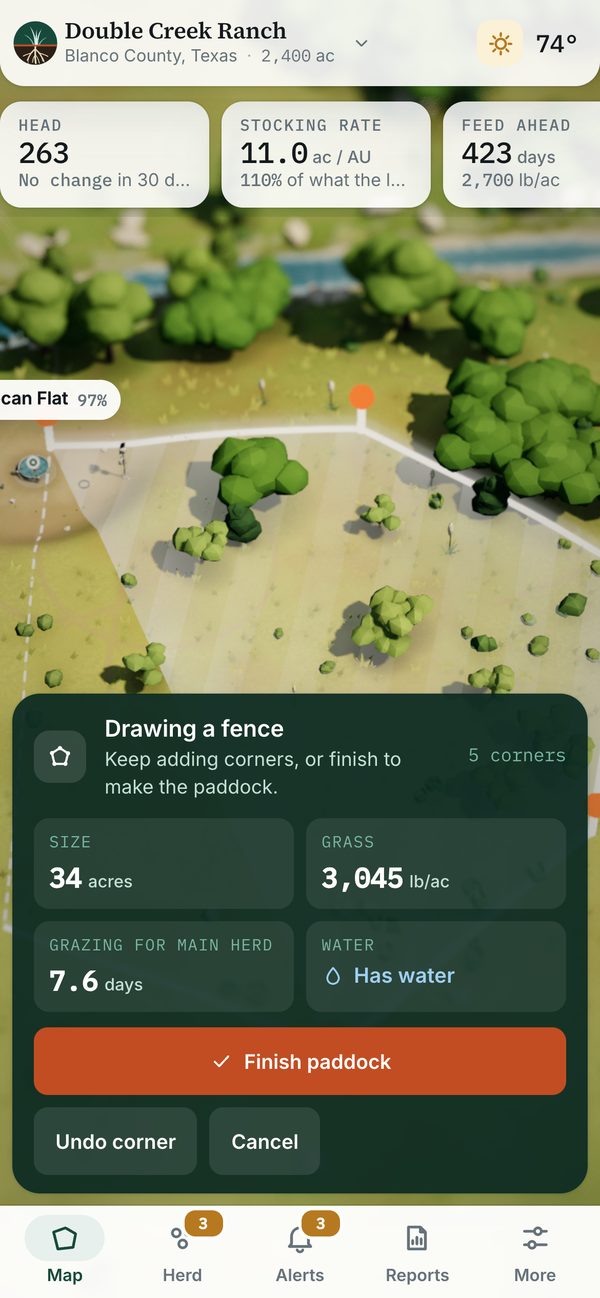
  5. Phone screen: drawing a new paddock, with its acres, grass and days of grazing
    Draw a fence with your thumb

What you can do with it

Everything you'd drive out to check, without the drive.

The screens below are from Double Creek, our demo ranch: 2,400 acres in Blanco County, Texas. You can open it and click around yourself.

The main herd loose on open range near West Mill, with the herd card showing 220 cows, 193 calves, 9 bulls and 202 bred

Herd and collars

Every head on the map, every collar reporting in.

The herd card tells you what you'd otherwise count at the gate: cows, calves, bulls and how many are bred, what they eat a day and what they're gaining. Click any animal for her weight, body condition and breeding.

  • Collar alerts for the ones to look at first: rumination down, heat stress, calving, lameness.
  • A loose herd is called out, so open range doesn't go ungrazed or overgrazed.
The herd's weights tab: a histogram of daily gain across 220 cows, the average cow at 1,129 pounds, and 11 cows flagged to watch

Walk-over scales

Weighed every time she drinks.

A walk-over scale at the trough reads each tag as the cow comes in to water. You get the average cow, her gain a day, and a short list of slow gainers to check, without running anyone through the chute.

  • The trough, pump, weather station and mineral feeder at each water point, in one card.
  • Gallons drunk today and how many head are drinking right now.
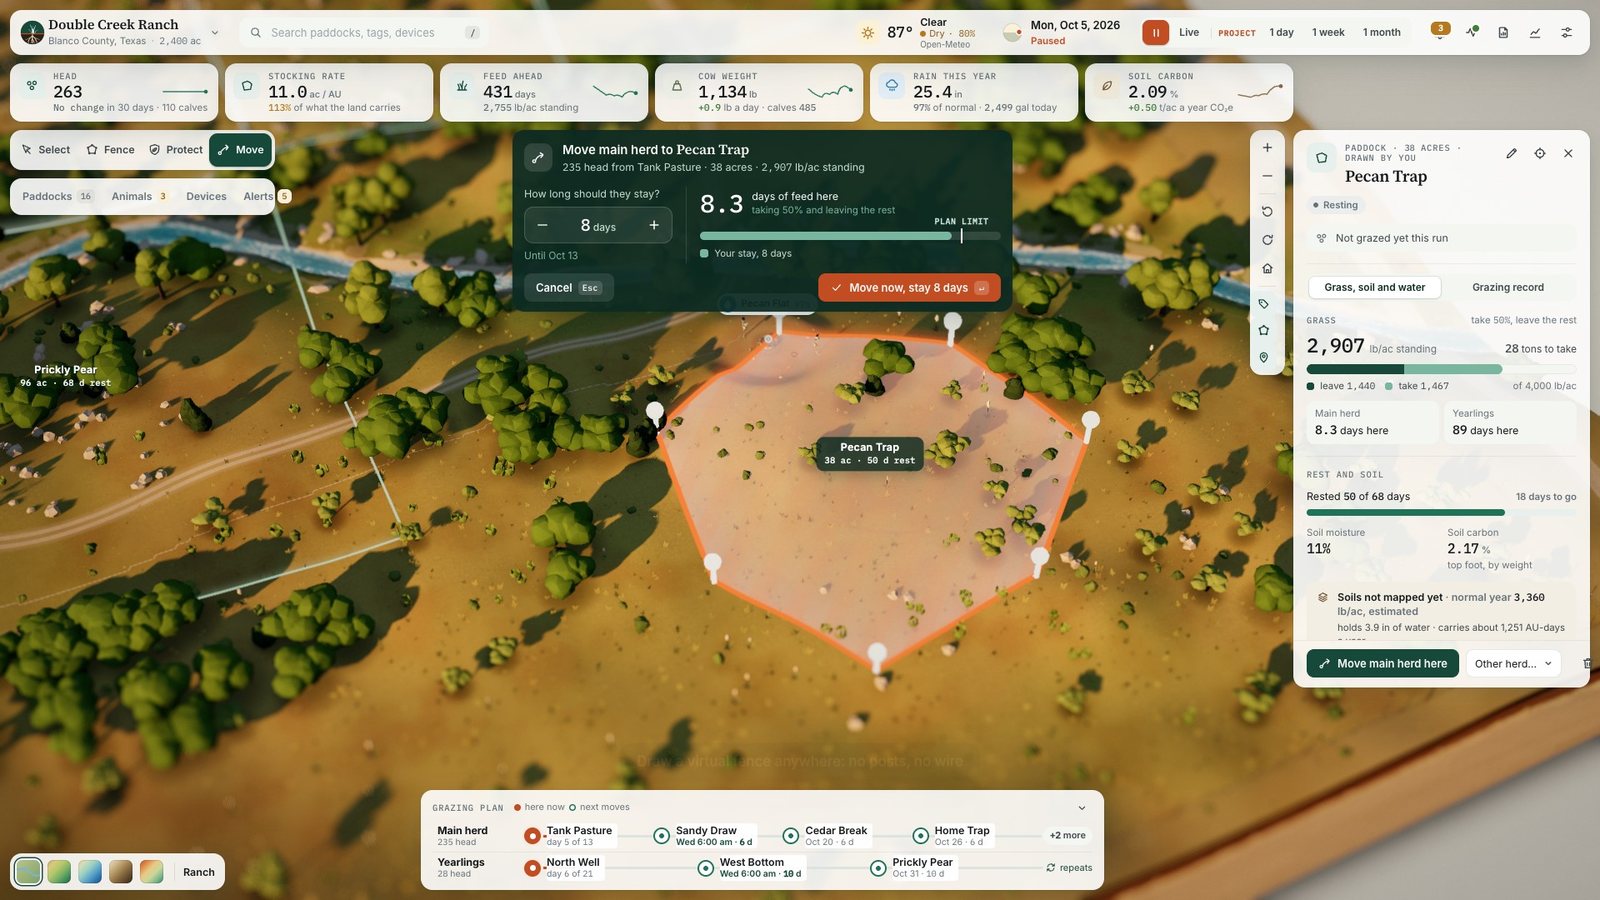
A new 38-acre paddock called Pecan Trap, with the move card asking how long the main herd should stay: 2 days, against 2.5 days of feed

Virtual fences and moves

Draw a fence. No posts, no wire.

Click the corners and it tells you the size, the standing grass and how many days it'll feed the herd before you've finished drawing. Pick how long they stay, and the collars walk them there, on to fresh grass.

  • Schedule the next move for 6 am and it happens while you're having coffee.
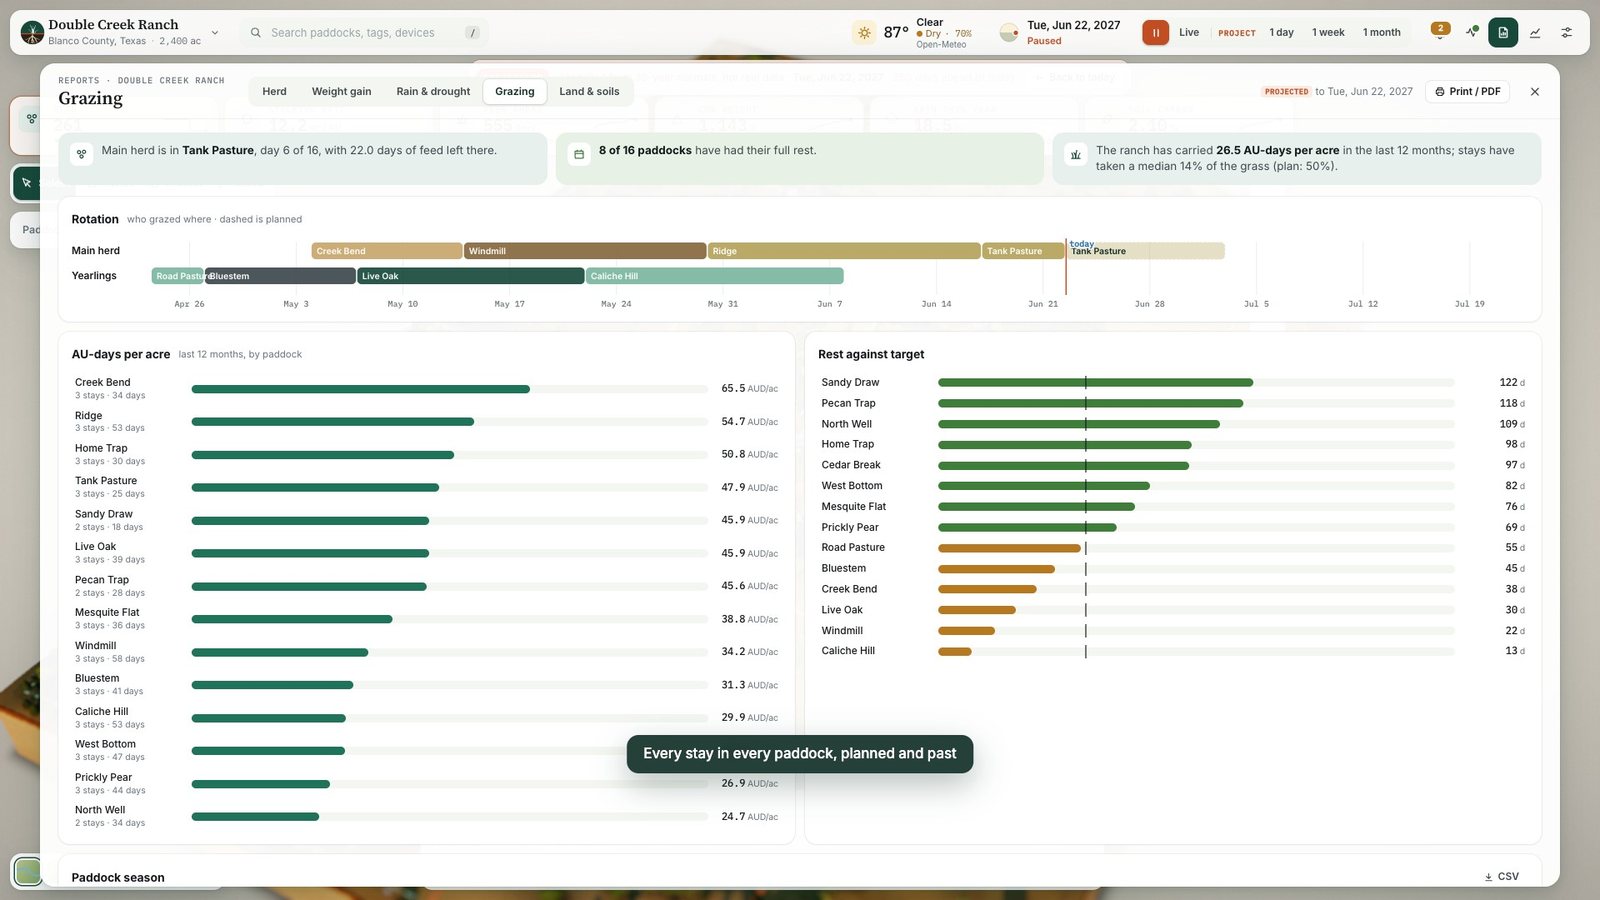
  • A grazing plan for every herd: where they are now, and the next moves in order.
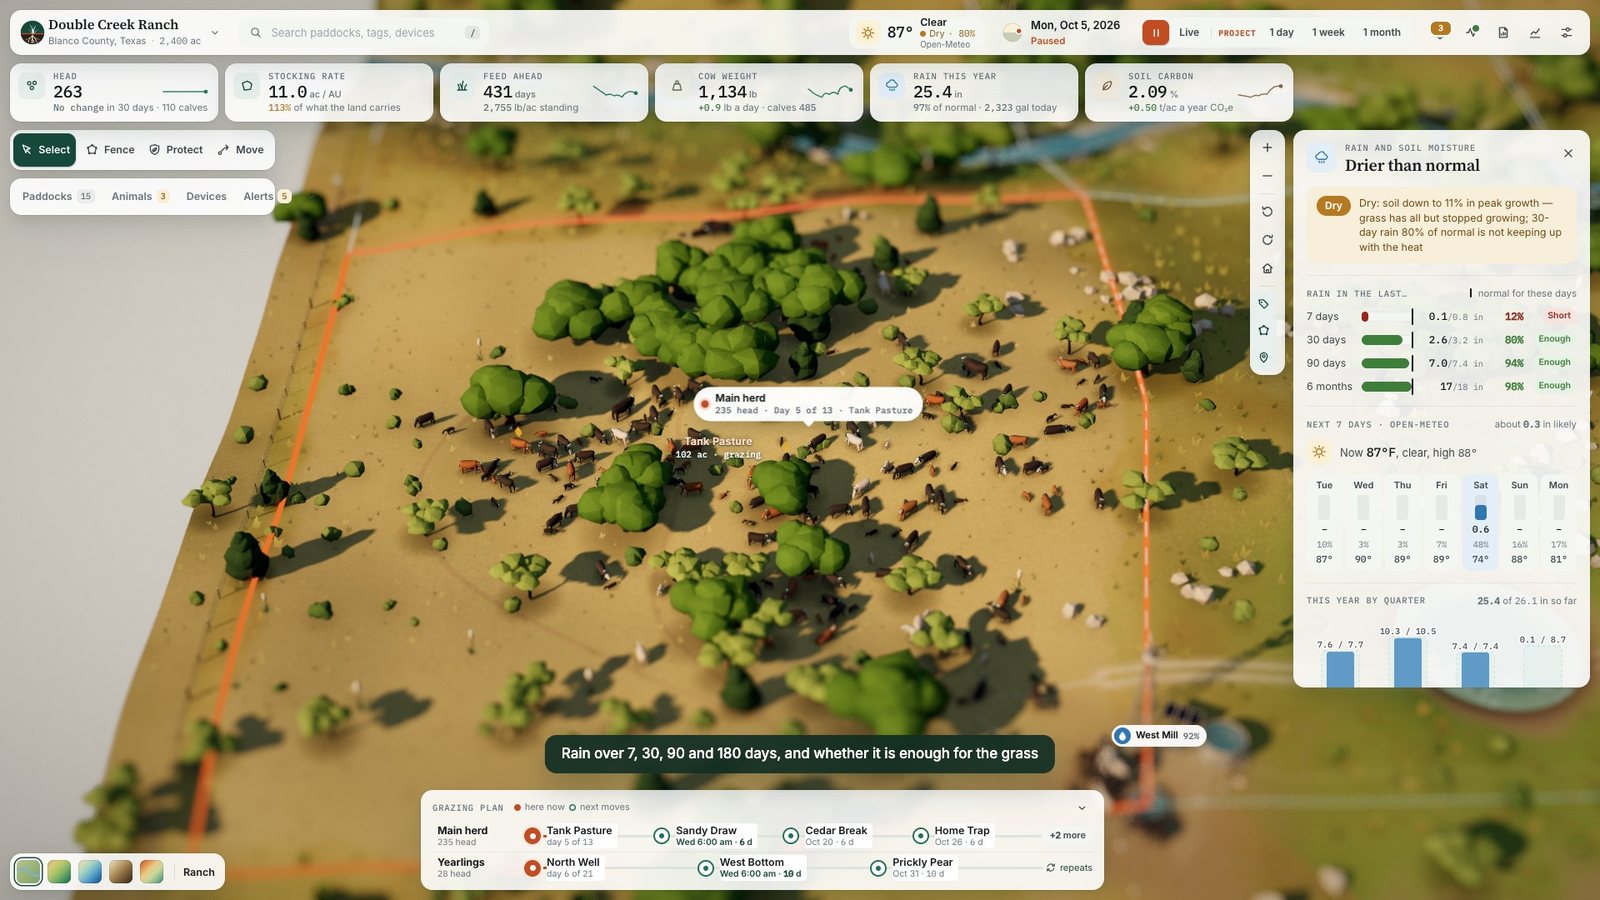
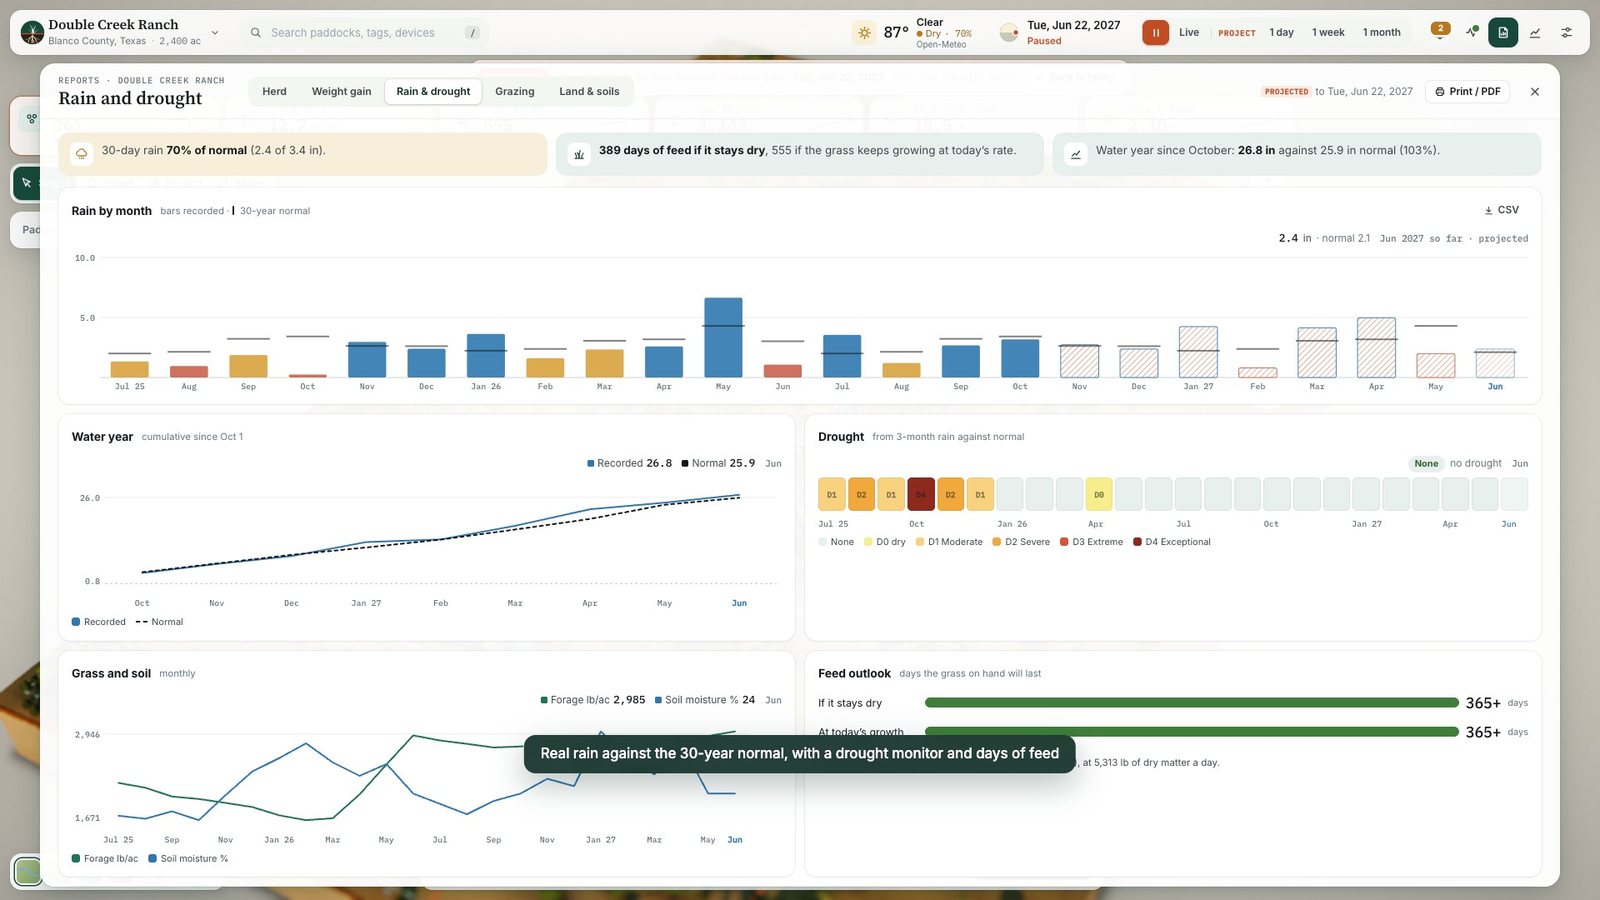
The rain card: rain over the last 7, 30, 90 days and 6 months against normal, topsoil moisture at 24 percent, and a 7-day forecast

Rain and drought

Rain you can plan around.

Your actual rain over the last 7, 30, 90 and 180 days, set against what's normal for those days, with the topsoil moisture and the week ahead. It says plainly whether it's enough for the grass.

  • The water year so far against the 30-year normal.
  • Days of feed on hand, if it stays dry and if the grass keeps growing.
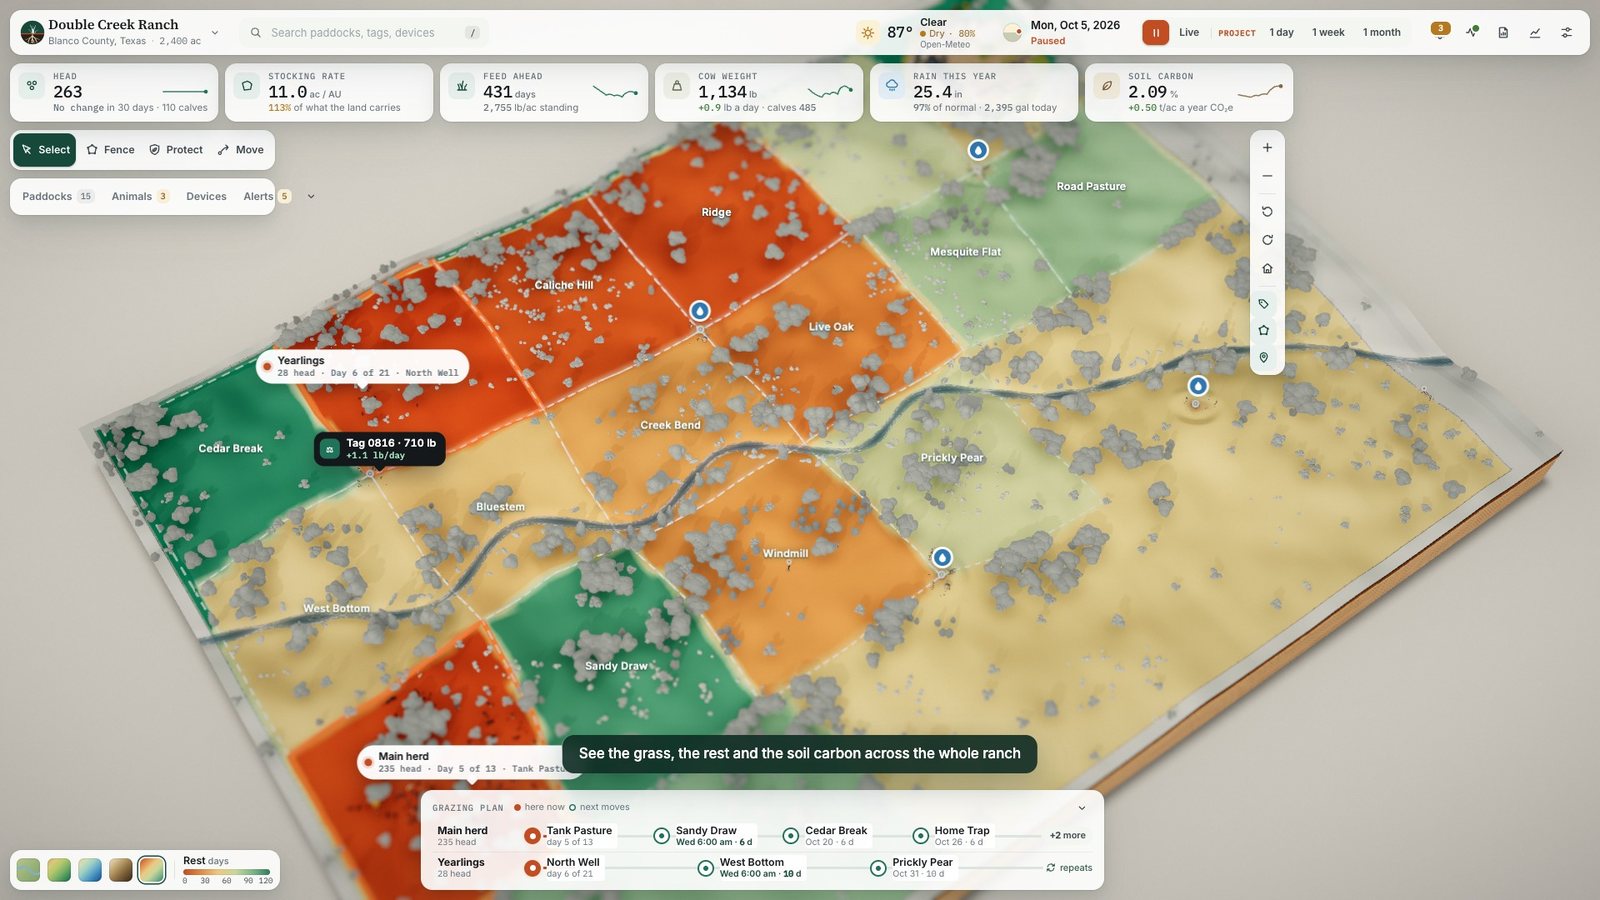
The whole ranch recoloured by standing forage, from short grazed paddocks to tall rested grass

Soils and carbon

See the grass, and the ground under it.

Switch the ranch to forage, rest or soil carbon and the whole table recolours, paddock by paddock. Soils come from the USDA soil survey for your exact place, and the carbon in the top foot is modelled from your soils and the way you graze.

  • Every paddock shows its grass, its rest against target, its moisture and its carbon.
  • The model's edge is cut like a real slab: dark topsoil, subsoil, caliche, roots.

Protected areas

Keep them off the creek bank.

Draw a protected area round a creek bank, a new seeding, a wet spot or a stand of young pecans, the same way you draw a fence. The collars keep the herd out, and if you try to move cattle into one, it tells you to pick a paddock instead.

  • It shows how much grass you're setting aside, and how it comes back while it rests.
  • No temporary wire to run, roll up and run again.

Reports

The numbers you'd want at the bank, or the sale barn.

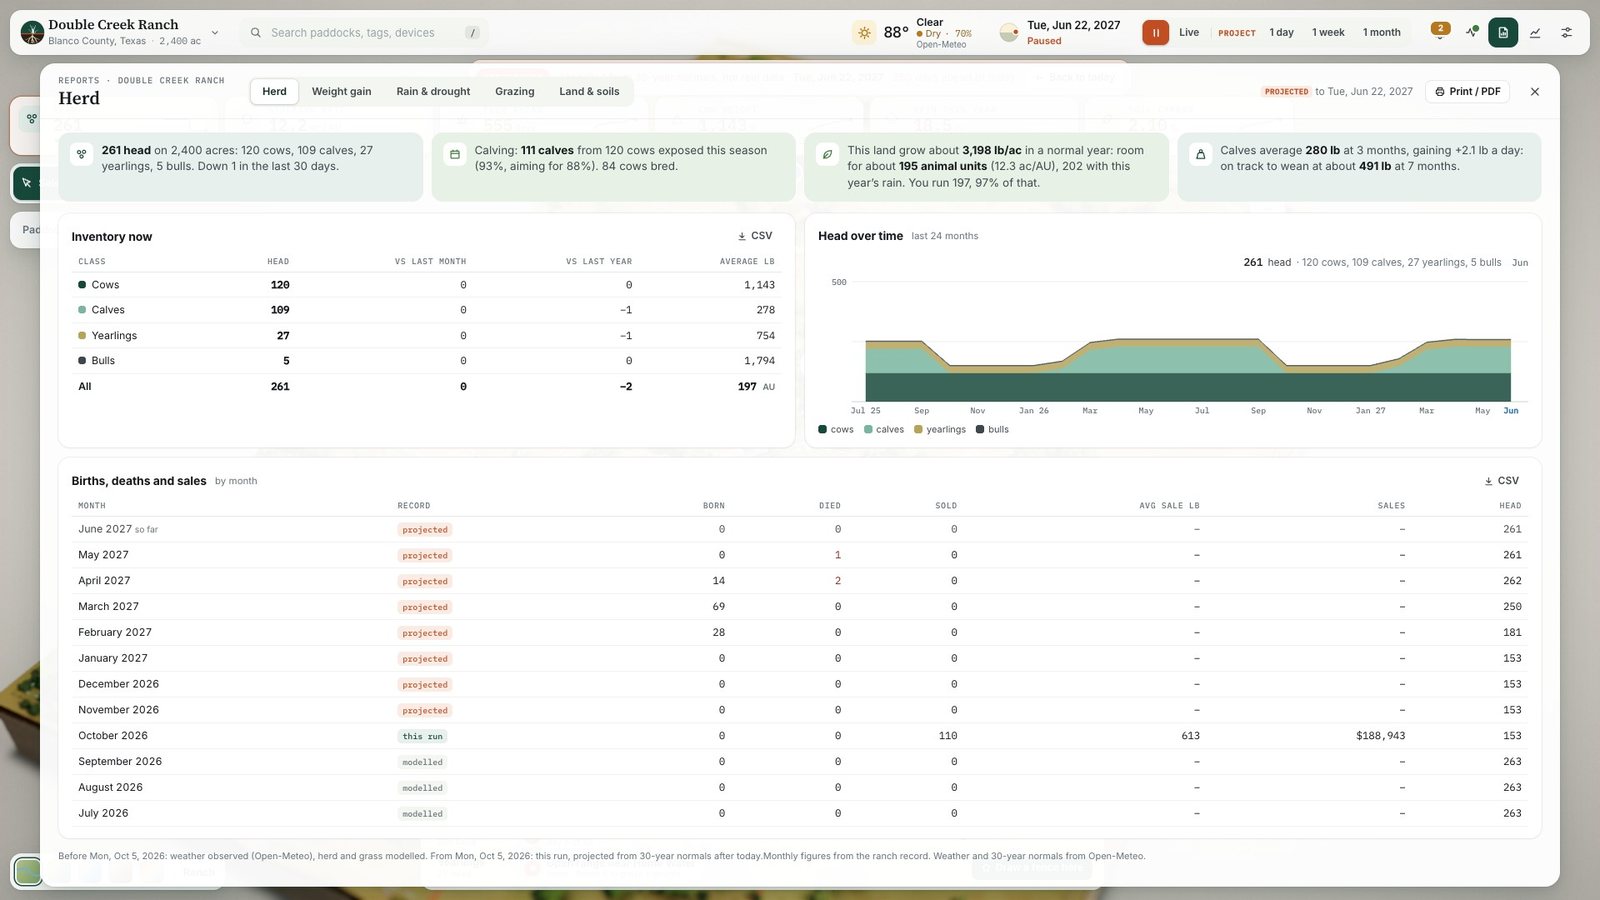
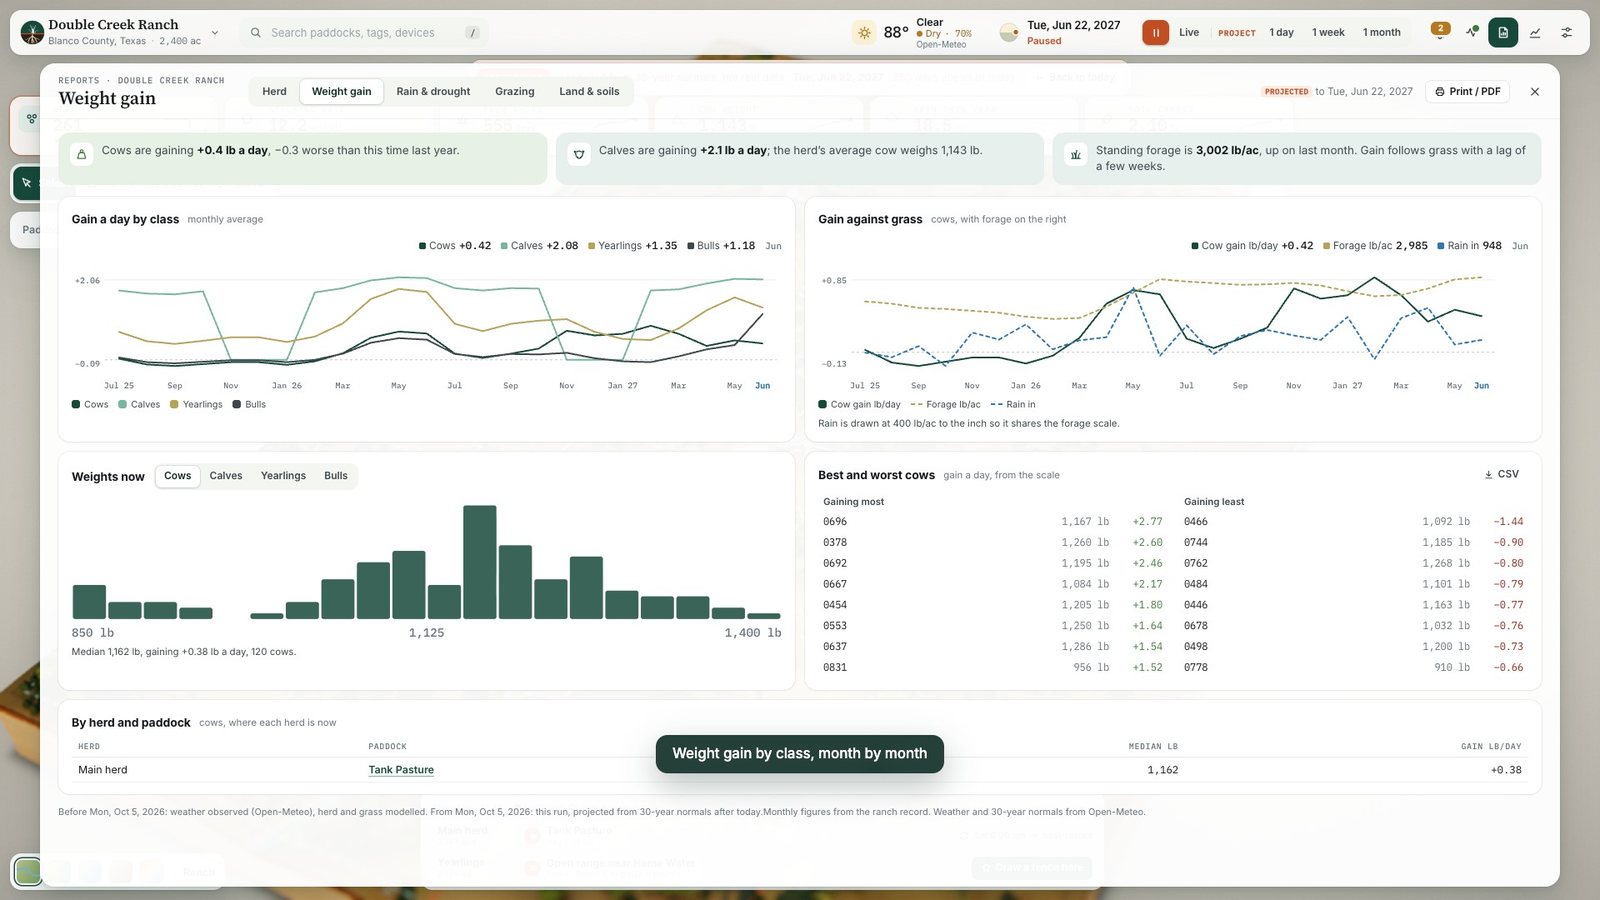
Four reports, each opening with the headline in a sentence. Every table exports to CSV, and every tab prints to PDF.

Herd report: inventory by class, head over 24 months, and births, deaths and sales by month
  • Inventory now. Head by class, with the change on last month and last year and the average weight of each.
  • Calving. Calves against cows exposed this season, set against the rate you're aiming for.
  • Births, deaths and sales by month, with average sale weights and what they brought.

See it run

Ninety seconds on Double Creek.

The whole ranch, one cow's collar card, the North Well scale, the ground layers, a new paddock fenced on open range and the herd moved into it across the creek. Then a jump to May, with the grass greening and the calves arriving.

Built on real data

Your place, layer by layer, from the sky down to the roots.

Nothing on your ranch is made up to look nice. Each layer comes from a public source, and you can see which.

Open-MeteoYour rain and temperature as it fell, up to yesterday. The 30-year normals. The live 7-day forecast.
Esri World ImageryTree cover and greenness, read from satellite imagery of your land.
OpenStreetMapCreeks, lakes, roads and buildings, where they really are.
AWS Terrain TilesElevation for every ridge, draw and creek bottom.
USDA NRCS SSURGOThe soil survey for your exact place: soil types, depth and organic matter.

What's real, and what's modelled

Real

  • Your boundary, terrain, creeks, roads and buildings
  • Tree cover and soils
  • Rain and temperature up to yesterday
  • 30-year normals and the 7-day forecast
  • Your herd: counts or your own records
  • With collars and scales on: where they are and what they weigh

Modelled

  • Grass growth, from your soils and your rain
  • Grazing and intake
  • Weights and gain, where there's no scale
  • Calving and weaning dates
  • Soil carbon change
  • Anything past today
Projection Modelled from 30-year normals, not real data

Fast-forward a week, a month or a season and every screen carries that label, so a projection is never mistaken for your ranch today.

Questions

Straight answers.

Anything else, open the demo ranch and poke at it. It's the quickest way to see what it does.

What's real and what's modelled?

The land is real: your boundary, terrain, creeks, roads, buildings, tree cover and soils all come from public data for your place. So is the weather: your actual rain up to yesterday, the 30-year normals and the live forecast. Your herd comes from your own counts or records. Grass growth, grazing, gain and soil carbon are modelled from those. Anything ahead of today is a projection from the normals, and it's labelled that way on screen.

Do I need collars or scales to use it?

No. You can set up your land and herd, plan the rotation and read the rain and drought reports without any hardware. When you set up, you say what you have, or plan to have. Collars are what move cattle on virtual fences and put them on the map; walk-over scales are what put real weights in. Animals on ear tags only are still seen at the scale and the trough.

What does it cost?

Grazed Roots is in early access. You can create your own ranch and explore the demo ranch now. Pricing for the platform and for the collars and scales isn't published yet.

How do I get a KML of my place?

In Google Earth, draw a polygon round your place, right-click it and choose Save Place As, then KML. In Google My Maps, draw your boundary and export to KML or KMZ. If you name extra shapes "paddock", "trough", "house", "gate" or "keep out", they're placed for you. Anything missing is laid out automatically.

Can I bring my herd records?

Yes. Upload a herd spreadsheet from CattleMax, AgriWebb, or any CSV or Excel file, and the herd is built from your own animals. Or just type in how many cows, calves, bulls and yearlings you run.

Where does the weather come from?

Open-Meteo, for your exact location: the observed record up to yesterday, 30-year normals, and the 7-day forecast. Every ranch opens on today's date, with the grass and soil spun up from the last two years of real weather.

Put your place on the table.

Bring a KML and a rough head count. You'll be looking at your own ranch before the coffee's cold.

Watch the tour Already set up? Login